Table of Contents
Did you know that infographics are 30 times more likely to be read than text-based articles? In today’s fast-paced digital world, visual content isn’t just a nice-to-have—it’s a necessity. Infographics have become a go-to tool for breaking down complex information, making it digestible, engaging, and shareable. Whether you’re presenting data, explaining a process, or telling a story, infographics can transform your content into something people actually want to consume.
But here’s the catch: many people assume you need to be a professional designer or have advanced design skills to create eye-catching infographics. Spoiler alert—you don’t. Thanks to user-friendly tools like Visme, anyone can create stunning, professional-quality infographics in minutes, no design degree required.
In this guide, we’ll show you how to harness the power of infographics—even if you’ve never opened a design tool before. Let’s dive in and turn your ideas into visuals that captivate your audience!
Why Use Infographics?
Infographics are more than just pretty visuals—they’re a powerhouse for communication. Here’s why they should be a staple in your content strategy:
Simplify and Visualize Data for Better Understanding
Let’s face it: raw data can be overwhelming. Infographics take complex information and turn it into something visually appealing and easy to grasp. For example, instead of listing statistics about climate change, an infographic can use charts, icons, and illustrations to show the impact in a way that’s instantly understandable.
Increase Content Shareability and Engagement on Social Media
Visual content is king on social media. Infographics are 3 times more likely to be shared than any other type of content. Why? Because they’re eye-catching, informative, and easy to consume. A well-designed infographic can stop someone mid-scroll, spark their interest, and encourage them to share it with their network.
Improve SEO with Higher Chances of Backlinks and Shares
Infographics are a secret weapon for boosting your SEO. They’re highly shareable, which means other websites are more likely to link back to your content. For instance, a study by HubSpot found that infographics generate 12% more traffic than text-based content. Plus, they can help you rank for keywords by making your content more engaging and link-worthy.
Real-Life Examples of Infographic Success
- Venngage: A marketing agency increased its website traffic by 12% by consistently using infographics in its blog posts.
- Neomam Studios: Their infographic on “13 Reasons Why Your Brain Craves Infographics” went viral, earning over 20,000 shares and countless backlinks.
Infographics aren’t just a trend—they’re a proven way to make your content stand out, drive engagement, and deliver results. Ready to create your own? Let’s move on to the tools and tips that make it easy!
Common Barriers to Creating Infographics
Infographics are undeniably powerful, but many people hesitate to create them because of a few common roadblocks. Let’s break them down:
1. Lack of Design Skills or Experience
For many, the idea of designing an infographic feels intimidating. You might think, “I’m not a designer—how can I create something professional?” The truth is, you don’t need to be a design expert to make stunning visuals. With the right tools and a little guidance, anyone can create infographics that look like they were made by a pro.
2. The Time Investment of Creating Visuals from Scratch
Designing an infographic from scratch can be time-consuming, especially if you’re starting with a blank canvas. Between choosing colors, fonts, layouts, and icons, the process can feel overwhelming. But what if you could skip the heavy lifting and use pre-designed templates instead? Spoiler: you can!
3. Limited Access to Tools or Resources
Not everyone has access to expensive design software like Adobe Illustrator or a team of graphic designers. And even if you do, learning these tools can take hours (or even days). The good news? There are affordable, user-friendly tools designed specifically for non-designers.
The Solution?
The barriers above might feel daunting, but they’re not insurmountable. With the rise of intuitive design platforms like Visme, Canva, and Piktochart, creating infographics has never been easier. These tools come packed with templates, drag-and-drop features, and ready-to-use assets, so you can focus on your message—not the design process.
In the next section, we’ll explore how to choose the right tool for your needs and start creating infographics like a pro, no matter your skill level. Stay tuned!
The Solution: Design Tools Like Visme
Creating stunning infographics doesn’t have to be complicated or time-consuming—thanks to tools like Visme. Whether you’re a complete beginner or a seasoned pro, Visme makes it easy to design visuals that captivate your audience. Let’s dive into what makes Visme the go-to solution for infographic creation.
What is Visme?
Visme is an all-in-one design platform that empowers anyone to create professional-quality visuals, from infographics and presentations to social media graphics and reports. Its mission? To make design accessible to everyone, regardless of skill level.
Why Choose Visme Over Other Tools?
Here’s what sets Visme apart from the crowd:
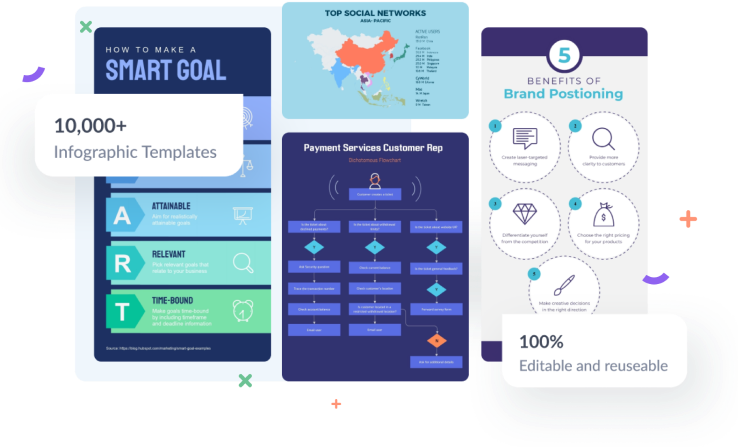
- Pre-Designed Templates
Say goodbye to staring at a blank screen! Visme offers hundreds of customizable infographic templates tailored to various industries and purposes. Whether you’re visualizing data, explaining a process, or telling a story, there’s a template to fit your needs. - Drag-and-Drop Functionality
No design experience? No problem. Visme’s intuitive drag-and-drop editor lets you easily add, move, and resize elements. It’s as simple as clicking, dragging, and dropping—no technical skills required. - Extensive Library of Icons, Images, and Charts
Need icons, stock photos, or data visualizations? Visme’s built-in library has you covered. With thousands of assets at your fingertips, you can create visually rich infographics without ever leaving the platform. - Built-in Animations and Interactivity Features
Want to take your infographics to the next level? Visme lets you add animations and interactive elements like hover effects, clickable links, and embedded videos. These features make your infographics more engaging and memorable.
Why Visme is Perfect for Beginners
Visme is designed with simplicity in mind. Its user-friendly interface and step-by-step guidance make it easy for anyone to get started. Plus, the platform offers tutorials, webinars, and a supportive community to help you along the way.
With Visme, you don’t need to be a designer to create stunning infographics—you just need a great idea and a few minutes of your time. Ready to get started? Let’s explore how to use Visme to bring your infographic ideas to life!
Step-by-Step Guide to Creating Infographics with Visme
Ready to create your first infographic? With Visme, the process is simple, fast, and fun. Follow this step-by-step guide to design a stunning infographic that grabs attention and delivers your message effectively.
Step 1: Sign Up for Visme and Choose the Infographic Template
- Sign up for free: Head to Visme’s website and create an account. It only takes a few seconds!
- Choose a template: Browse Visme’s extensive library of infographic templates. Whether you’re in marketing, education, healthcare, or any other industry, there’s a template for you. Need to visualize data? Explain a process? Tell a story? There’s a template for that too.
Step 2: Customize the Design
- Edit colors and fonts: Match the template to your brand by customizing the color palette and typography. Visme makes it easy to apply your brand colors and fonts consistently across the design.
- Add or edit text: Replace placeholder text with your own content. Use headings, subheadings, and bullet points to make your infographic easy to scan.
- Enhance visuals: Use Visme’s library of icons, shapes, and illustrations to add visual interest. Drag and drop elements to create a layout that’s both functional and eye-catching.
Step 3: Add Data Visualizations
- Insert charts and graphs: Use Visme’s built-in tools to add bar charts, pie charts, line graphs, and more. Simply click on the chart icon, choose your preferred style, and input your data.
- Upload data files: For larger datasets, upload CSV or Excel files to automatically generate charts. This feature saves time and ensures accuracy.
- Add maps: If your infographic includes geographic data, use Visme’s map tool to highlight regions or countries.
Step 4: Include Your Logo and Brand Elements
- Add your logo: Upload your logo and place it strategically in the design. This helps reinforce your brand identity.
- Maintain consistency: Use your brand’s colors, fonts, and tone of voice throughout the infographic. Consistency builds trust and makes your content instantly recognizable.
Step 5: Export and Share
- Download your infographic: Once your design is complete, export it in your preferred format. Visme offers options like PNG, JPEG, PDF, and even HTML5 for interactive infographics.
- Embed on your website: Use Visme’s embed code to seamlessly integrate your infographic into blog posts or web pages.
- Share directly: Publish your infographic directly to social media platforms like LinkedIn, Twitter, or Facebook. You can also share it via email or generate a shareable link.
And that’s it! In just five simple steps, you’ve created a professional-quality infographic—no design skills required. With Visme, the possibilities are endless. Start designing today and watch your content come to life!
Tips for Creating Impactful Infographics
Creating an infographic is one thing, but making it truly impactful is another. To ensure your infographic not only looks great but also resonates with your audience, follow these expert tips:
1. Know Your Audience
Before you start designing, ask yourself: Who is this infographic for? Tailor your visuals, tone, and content to match your audience’s preferences, knowledge level, and interests. For example:
- A tech-savvy audience might appreciate detailed data visualizations.
- A general audience might prefer simple, easy-to-understand visuals with minimal jargon.
2. Keep It Simple
Less is more when it comes to infographics. Avoid overwhelming your audience with too much information. Instead:
- Focus on 1–2 key ideas or messages.
- Use white space strategically to give your design room to breathe.
- Stick to a clean, uncluttered layout that guides the viewer’s eye naturally.
3. Use Contrasting Colors
Color is a powerful tool for making your infographic visually appealing and easy to read. Here’s how to use it effectively:
- Choose a color palette that aligns with your brand and ensures readability.
- Use contrasting colors to highlight important data points or sections.
- Avoid using too many colors—stick to 3–4 main colors for a cohesive look.
4. Tell a Story
The best infographics don’t just present data—they tell a story. Organize your information into a logical flow that guides the viewer from start to finish. For example:
- Start with a compelling headline or statistic to grab attention.
- Use sections or steps to break down the information.
- End with a strong conclusion or call-to-action (e.g., “Learn more,” “Share this infographic”).
5. Test and Optimize
Your first draft doesn’t have to be perfect. Test your infographic with a small group of people and gather feedback. Ask questions like:
- Is the message clear?
- Are the visuals engaging?
- Is the design easy to follow?
Use this feedback to refine your design and make it even better.
By following these tips, you’ll create infographics that not only look stunning but also drive engagement and deliver results.
Real-Life Examples of Infographics Created Without Design Skills
Still not convinced you can create stunning infographics without design experience? Let’s take a look at real-life examples and hear from users who’ve successfully used Visme to bring their ideas to life.
Examples of Infographics Created with Visme
Here are a few examples of infographics made by Visme users:
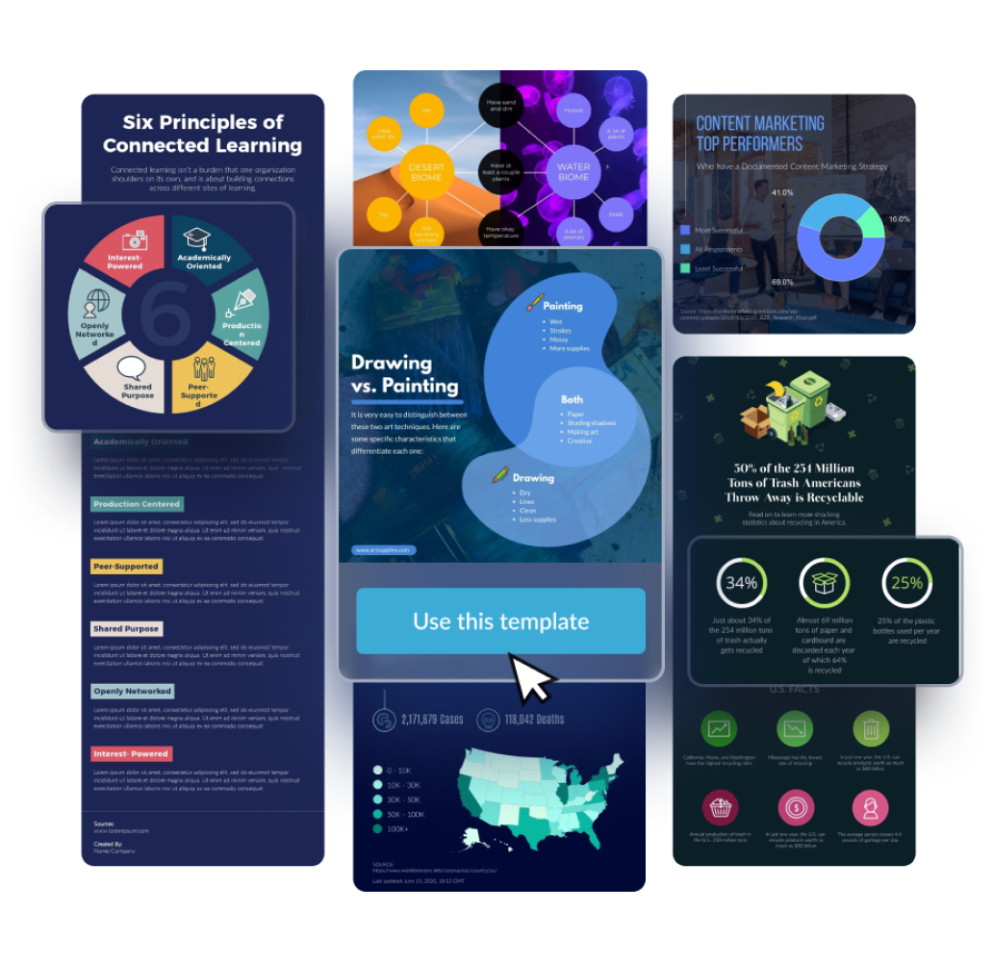
Want to see more? Check out Visme’s template library for inspiration.
Testimonials from Visme Users
Don’t just take our word for it—here’s what real users have to say about creating infographics with Visme:
“We used to make all our presentations with PowerPoint, but once we discovered Visme, PowerPoint became a distant memory. Thanks, Visme, for simplifying our process!”
– Kevin Coughlin, Program Coordinator
“As a Marketing Manager and not a graphic designer, Visme allows me to create graphic representations of messaging quickly and professionally. The interface is easy to use, and I can download in a variety of formats depending on my overall purpose.”
– Anne Guyotte, Marketing Manager
“After trying tools like Canva and Adobe Spark, we picked Visme. Nothing else matched the flexibility, capabilities, or ease of use. The YouTube tutorials are excellent too.”
– Promod Sharma, Actuary
“Visme is easy to use and creates very professional-looking, unique graphics. I create graphics weekly, and Visme makes it easy.”
– Geriann Wiesbrook, Founder
“I adore the My Brand and Block features Visme has rolled out over the past year. It has vastly improved my ability to go from an idea to a clean and precise branded infographic without having to hire a graphic designer.”
– Claudia Pilgrim, Copywriter
“Visme is one of the most effective tools I have in my toolkit for creating infographics in a clean and clear way.”
– Julie, Director of Data Management
Why These Examples Matter
These testimonials and examples prove that you don’t need to be a designer to create professional-quality infographics. With Visme, anyone—from marketers and educators to non-profits and business owners—can create visuals that stand out and deliver results.
Explore more testimonials on Visme’s Wall of Love.
Conclusion
Infographics are more than just a trend—they’re a powerful tool for simplifying complex information, boosting engagement, and making your content stand out. Whether you’re a marketer, educator, or business owner, infographics can help you communicate your message in a way that’s both visually appealing and easy to understand.
The best part? You don’t need to be a designer to create professional-quality infographics. With user-friendly tools like Visme, anyone can design stunning visuals in minutes. From pre-designed templates and drag-and-drop functionality to an extensive library of icons, charts, and animations, Visme takes the guesswork out of design.
So, what are you waiting for? Try Visme today and see how easy it is to bring your ideas to life.
Start creating your own stunning infographics today—no design skills required!
FAQs
What are the best tools for creating infographics?
Some of the best tools for creating infographics include:
Visme: User-friendly, with templates, drag-and-drop functionality, and interactive features.
Canva: Great for beginners, offering simple design tools and free templates.
Piktochart: Ideal for creating data-driven infographics with ease.
Adobe Spark: A good option for those familiar with Adobe’s ecosystem.
Venngage: Specializes in infographics and offers a variety of templates.
For beginners, Visme stands out for its balance of simplicity and advanced features, making it a top choice for creating professional-quality infographics.
How can I design an infographic for free?
Many tools offer free versions or trials to help you design infographics without spending a dime. Here’s how:
Use Visme’s free plan to access basic templates and design features.
Try Canva’s free version, which includes a wide range of templates and design elements.
Explore Piktochart’s free tier for simple infographic creation.
While free plans may have limitations, they’re a great way to get started and experiment with infographic design.
What are the most important elements of a good infographic?
A great infographic includes:
Clear and concise content: Focus on one or two key messages.
Visual hierarchy: Use headings, subheadings, and visuals to guide the viewer’s eye.
Engaging visuals: Incorporate icons, illustrations, and charts to make data more digestible.
Color contrast: Use a cohesive color palette that ensures readability and visual appeal.
Logical flow: Organize information into a story or sequence that’s easy to follow.
By combining these elements, you can create infographics that are both informative and visually captivating.
Related Articles